Travel Time Analysis Methods
Comparing Snapshot and Vehicle Trajectory approaches for travel time calculation
Travel Time Analysis Methods: Snapshot vs Vehicle Trajectory
This project investigates the methodological differences between various travel time calculation approaches used in transportation engineering and traffic management. We conducted an in-depth analysis comparing Snapshot and Vehicle Trajectory methods, as well as Departure-based vs Arrival-based travel time calculations.
Research Focus
The research focused on analyzing and comparing different travel time calculation methods:
- Snapshot calculation methodology
- Vehicle Trajectory approaches
- Departure time-based travel time (DTT)
- Arrival time-based travel time (ATT)
Methodology Comparison
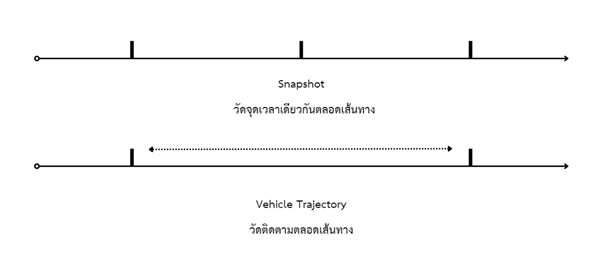
Snapshot vs Vehicle Trajectory

Snapshot Method:
- Summarizes travel times of vehicles in fixed time intervals
- Measures travel time at the same point on all road segments and combines them
- Advantages: Simple installation and system maintenance, more consistent measurements
- Limitations: Does not reflect dynamic traffic changes, less responsive to sudden congestion
Vehicle Trajectory Method:
- Identifies vehicle travel paths through sensor pairs
- Calculates travel time by finding the difference between origin and destination timestamps
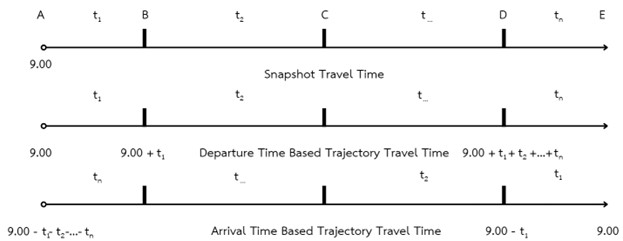
- Can be divided into two types: Departure time-based and Arrival time-based
- Advantages: Higher accuracy, real-time traffic monitoring, better reflection of actual driving experiences
- Limitations: Requires more complex tracking systems with higher costs, greater data variability
Departure-based vs Arrival-based Travel Time

Departure Time-based Travel Time (DTT):
- Calculated using departure time from origin as the primary data point
- Uses historical data or predictions to estimate travel time
- More suitable for advance trip planning
- Shows higher values during congestion periods, reflecting predicted travel times
- Can be calculated before or at the time a vehicle departs from origin
Arrival Time-based Travel Time (ATT):
- Calculated using arrival time at destination as the primary data point
- Analyzes multiple factors like driver behavior, intersections, traffic signals, etc.
- Higher accuracy using actual travel data
- Calculated only after a vehicle reaches its destination
- Typically shows lower values during congestion than DTT
- More suitable for real-time traffic analysis and management
Case Studies
Primary Highway Analysis
We conducted a detailed analysis on a major highway, examining 4 continuous segments spanning approximately 20 kilometers of roadway. The analysis used anonymized sensor pair data collected over a full year period and revealed significant statistical insights:
| Method | Relative Standard Deviation | Measurement Characteristics |
|---|---|---|
| Snapshot | Lowest | Most consistent measurements |
| DTT Vehicle Trajectory | Medium | Good for prediction |
| ATT Vehicle Trajectory | Highest | Most sensitive to actual traffic conditions |
Key Findings from Primary Highway Analysis:
- All three methods produced very similar mean travel times (within 1% of each other)
- The Snapshot method demonstrated the most consistent measurements
- ATT had the highest variability, indicating greater sensitivity to traffic fluctuations
- During congested periods, Snapshot and DTT showed 3-5% higher values than ATT
- During normal traffic flow, all three methods produced similar results (within 1-2% variance)
Hourly Traffic Patterns
Our hourly analysis revealed distinct traffic patterns throughout the day:
- Early morning: Lightest traffic; fastest travel times
- Morning commute: Gradually increasing traffic; times approximately 15% higher than early morning
- Mid-morning: Peak morning traffic; times approximately 20-25% higher than early morning
- Midday: Sustained moderate traffic; similar to mid-morning patterns
- Afternoon/evening rush: Heaviest traffic; peak times 80-100% higher than baseline
- Late evening: Decreasing traffic; times returning to near early morning levels
During peak congestion periods, we observed:
- Snapshot method consistently showed the highest values
- DTT method showed intermediate values
- ATT method consistently showed the lowest values (approximately 5% lower than Snapshot)
This pattern aligns with theoretical expectations where ATT typically shows lower values during congestion as it represents actual completed trips while DTT and Snapshot may capture vehicles still stuck in traffic.
Additional Highway Analyses
We also analyzed data from two additional highways, each divided into three continuous segments using sensor pair data:
Key Insights
Our comprehensive analysis revealed several important findings:
- Method Selection Based on Purpose:
- For real-time traffic monitoring: ATT provides the most accurate picture of completed trips
- For travel planning: DTT is more appropriate as it predicts travel times for departing vehicles
- For consistent traffic pattern analysis: Snapshot provides more stable measurements
- Traffic Condition Effects:
- The difference between methods is minimal during free-flow conditions (typically <2% variance)
- During congestion, differences become significant (up to 5-10% variance)
- DTT consistently shows higher values than ATT during peak congestion
- Hourly Variations:
- All methods reflect the same general traffic patterns throughout the day
- ATT has higher standard deviations during normal traffic periods
- Snapshot method shows the most consistent standard deviations throughout the day
- Data Distribution Characteristics:
- All three methods show right-skewed distributions
- Travel time data typically clusters around the mean value
- Snapshot method has narrower distribution with higher peaks
- DTT and ATT have wider distributions with extended right tails, particularly in ranges 50-150% above the mean
- During congestion, the distribution variance increases by approximately 300-400%
Mathematical Models
For a road segment AB with length L, the average speed can be calculated using:
\[v = \frac{L}{\frac{1}{n} \sum_{i=1}^{n} tt_i}\]Where:
- n is the number of vehicles used for averaging
- tt_i is the travel time of vehicle i
Applications
The findings from this research can be applied to:
- Real-time traffic management systems
- Advanced traveler information systems
- Traffic prediction models
- Transportation planning and policy development
- Smart city initiatives and intelligent transportation systems
- Congestion analysis and mitigation strategies
Recommendations
Based on our findings, we recommend:
- For traffic information systems intended for trip planning, DTT should be the primary calculation method
- For post-trip analysis and traffic performance evaluation, ATT provides the most accurate representation
- For long-term traffic pattern analysis, Snapshot can offer more consistent measurements
- Hybrid approaches combining multiple methods could provide more comprehensive understanding
References
- Taghipour, H., Parsa, A., & Mohammadian, A. K. (2020). Comparative analysis of travel time prediction methods.
- Moonam, H. M. (2016). Analysis of travel time reliability using trajectory data.
- Moonam, H. M., Qin, X., & Zhang, J. (2019). Utilizing data mining techniques to predict expected freeway travel time.
- Wilby, M. R., et al. (2020). Travel time prediction models and comparative analysis.